


The Truelytics score is an easy to understand number on a scale of 1-4 incorporating a firm’s financial metrics, plus business, client and market stability ratings. These ratings are broken out and graded A, B or C, and directly impact a firm's discount rate, which drives their valuation. These scores and discount rate allow one too easily benchmark a firm against others in the industry and identify opportunities to grow.
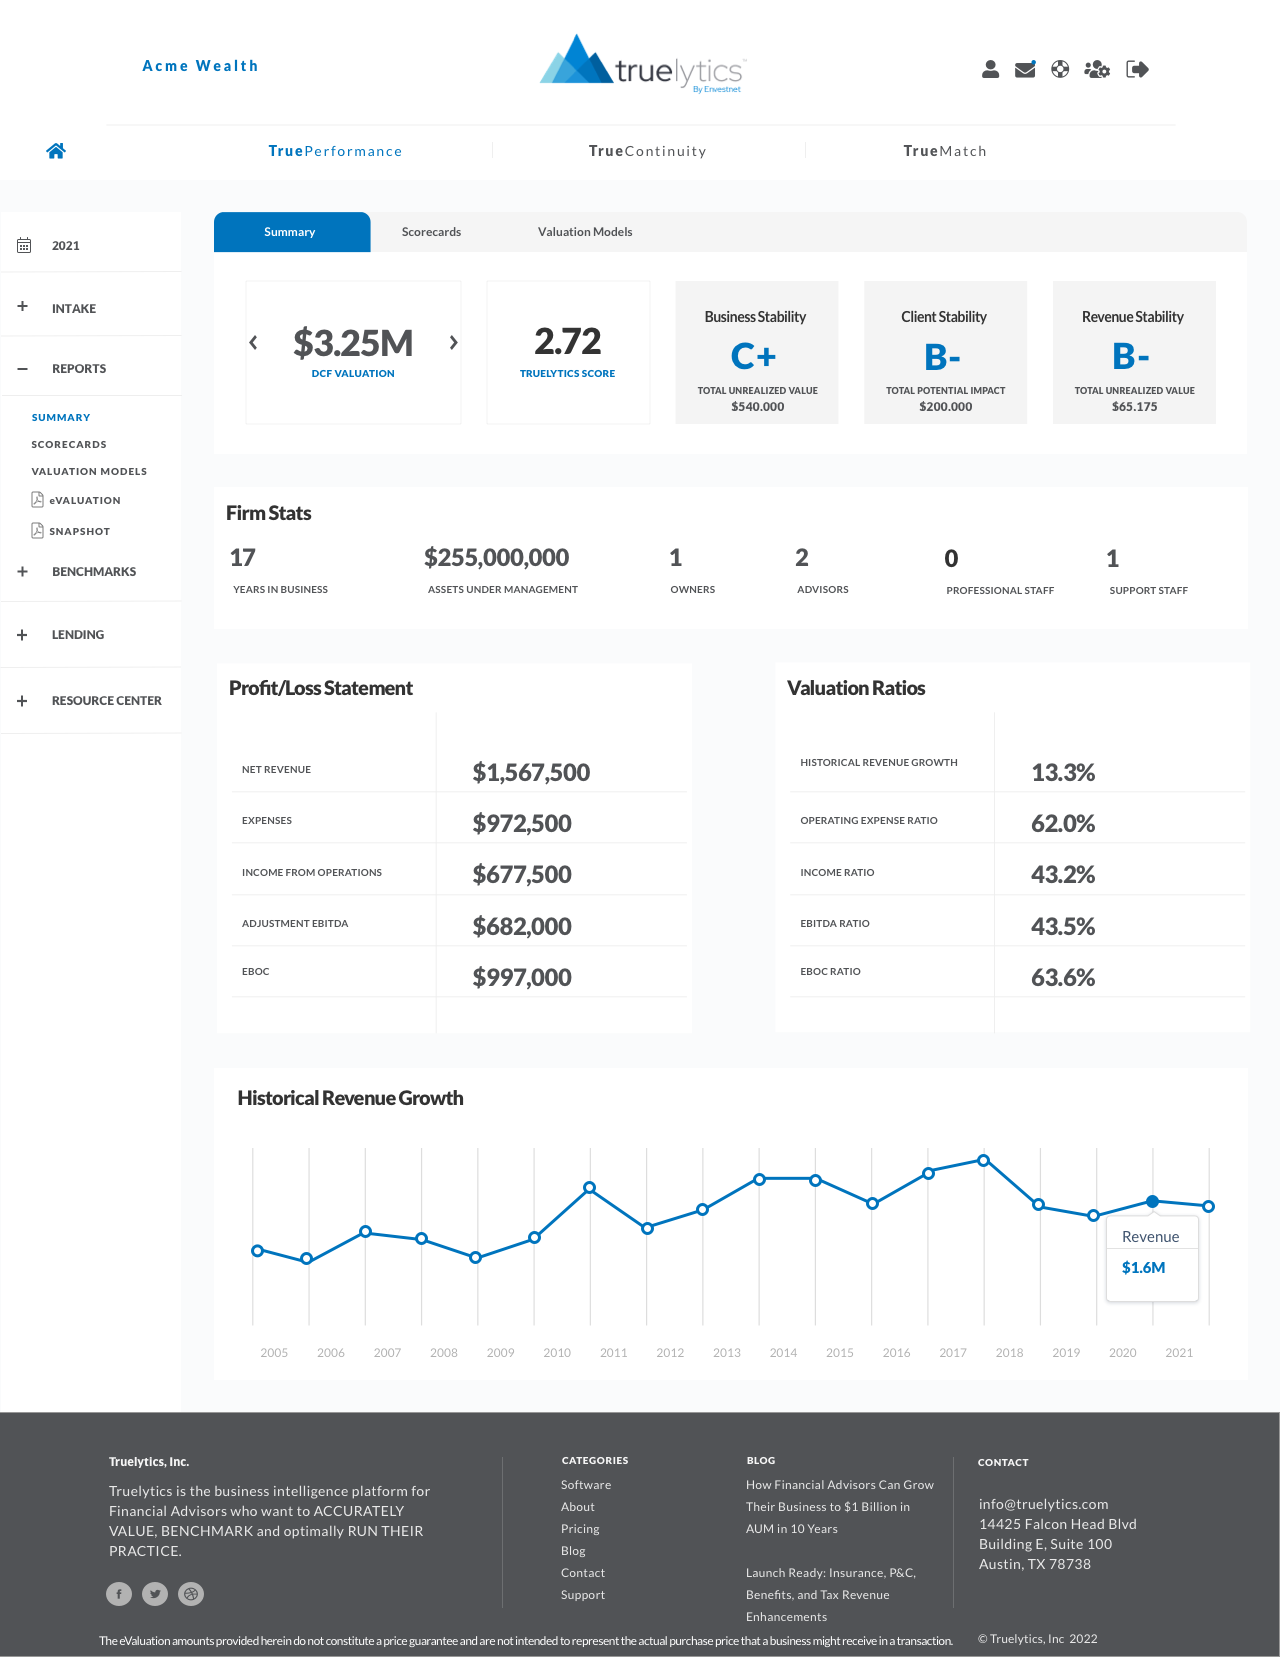
 Our Business Stability scorecard reflects the structure and operations of a firm. A stable business is not likely to fall when faced with the loss of any one person, client, or business process. Although there are many factors to consider in this section, many of them are directly under a firm's control.
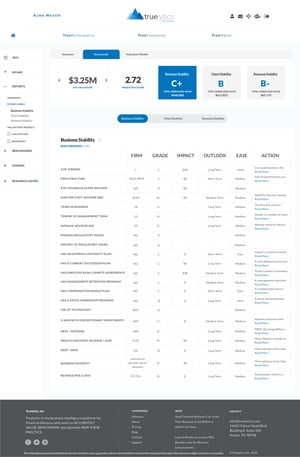
 Our Client Stability scorecard reflects the demographics and turnover of a firm's client base. It is important to have a diversified client base, frequent interactions with clients, and to build relationships with the next generation of wealth.
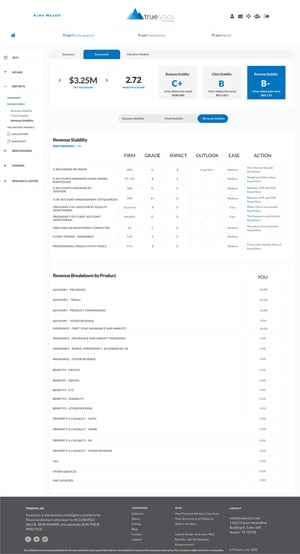
Your Revenue Stability Score reflects the revenue risk and fluctuations inherent in your revenue streams. Factors such as the percentage of recurring revenue, the use of model portfolios, and whether the investment process is done in-house or outsourced all play a role in the stability of your current and future revenue.
Product risk is a component of the stability as well, though not necessarily detrimental - exposure to the market can generate growth in good times. However, you should seek diverse revenue streams to counter the years with market losses. Stability can result, for example, from a mix of business services (such as financial planning) and products.
The Truelytics Pro-Forma is based on a firm's most recent year of financials. Revenue and expenses for the next 5 years are forecasted using the growth rate provided.
The pro-forma is created as flat-line growth when in reality it will be fluctuating with market movements. While none of us have a crystal ball to predict the future, this growth scenario is still a good indicator of trends in a generalized scenario.
There is a safeguard in the Truelytics system to prevent a falsely inflated valuation. If an expected growth rate is significantly higher than the historical growth rate, the Pro-Forma growth is limited to 5% over a firm's historical growth rate.
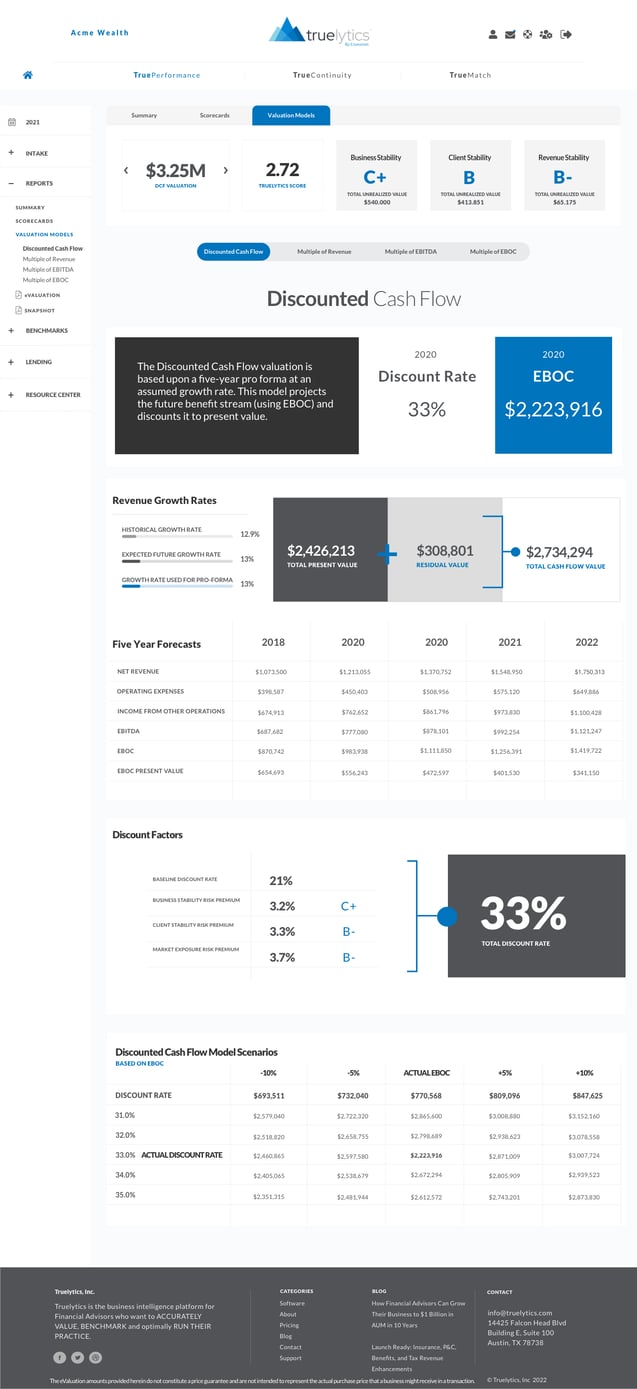
Truelytics presents multiple valuations under different scenarios. Our methodology of choice is the Discounted Cash Flow Model as this model best reflects future cash flow vs. past financial performance. We include alternative methodologies to reflect industry expectations.
The discounted cash flow methodology is usually the most widely used and accepted valuation method. The DCF model projects future cash flow and discounts it back to present day value. There are opportunities to lower the discount rate and improve a firm's valuation, such as such as increasing cash flow or improving KPI scores.
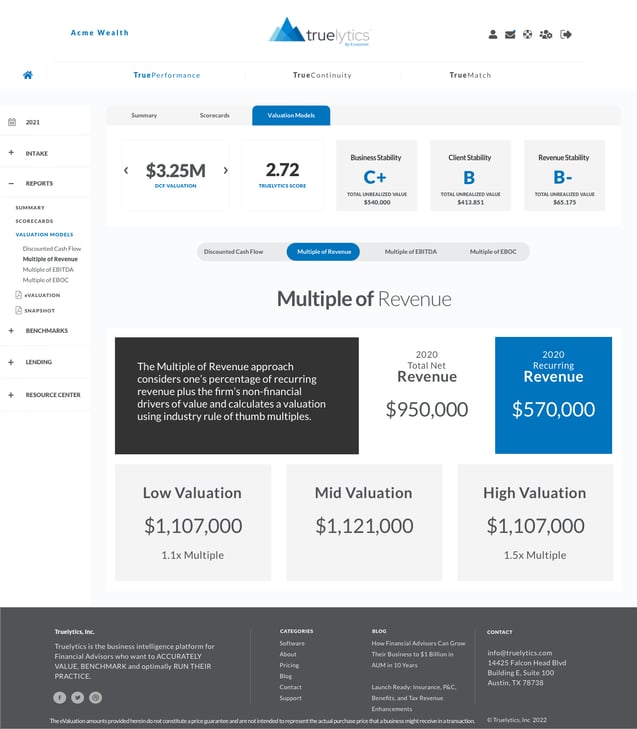
The Multiple of Revenue approach considers one’s percentage of recurring revenue plus the firm’s non-financial drivers of value and calculates a valuation using industry rule of thumb multiples.
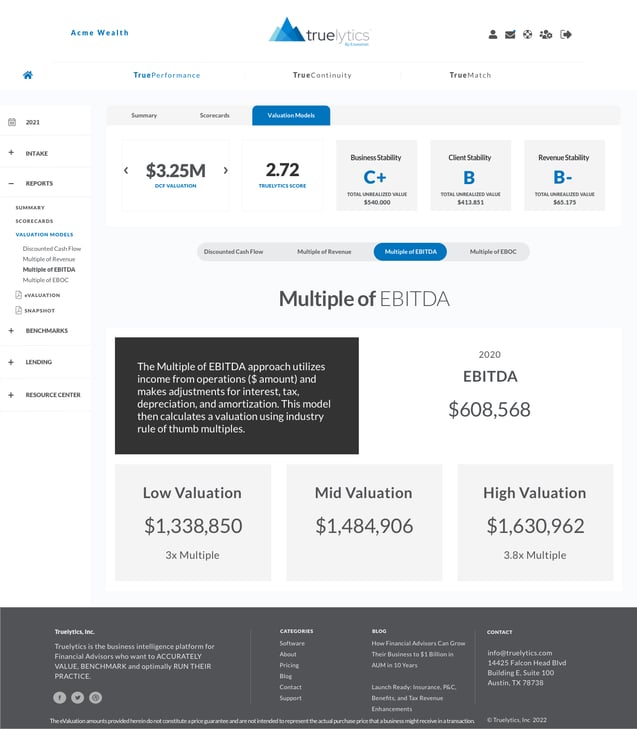
The Multiple of EBITDA approach utilizes income from operations ($ amount) and makes adjustments for interest, tax, depreciation, and amortization. This model then calculates a valuation using industry rule of thumb multiples.
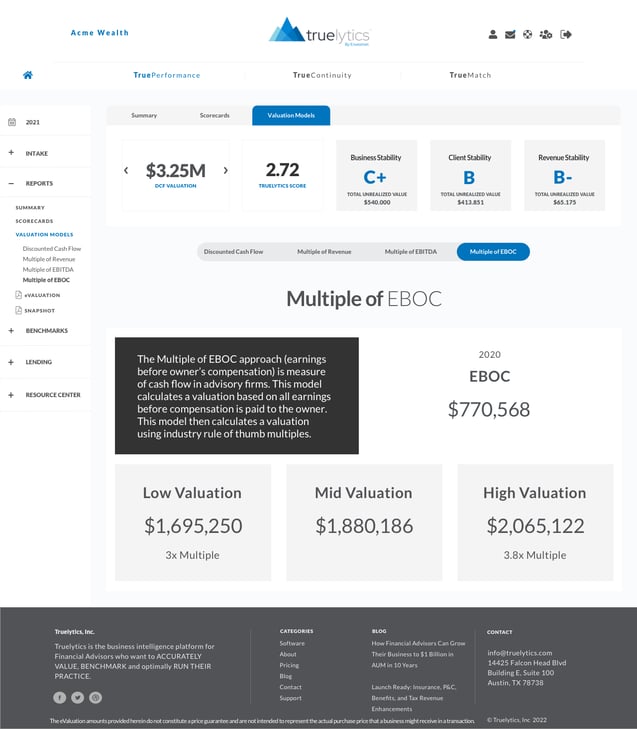
The Multiple of EBOC approach (earnings before owner’s compensation) is measure of cash flow in advisory firms. This model calculates a valuation based on all earnings before compensation is paid to the owner. This model then calculates a valuation using industry rule of thumb multiples.
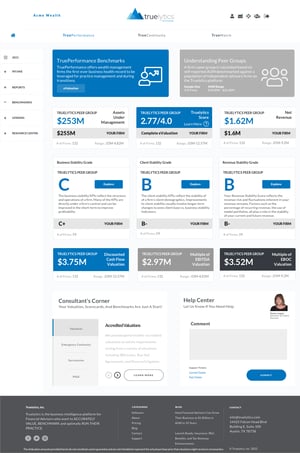 Filter against peers (those within +/- 25% of your AUM) and the market at large (our entire data set):
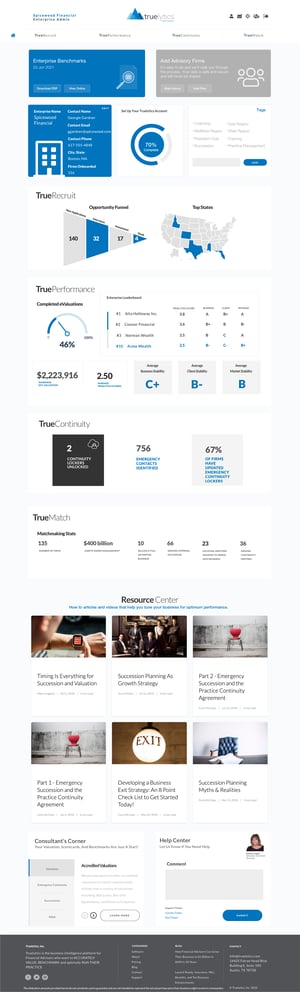 Truelytics Enterprise Benchmarks contain over 40 insightful dashboards that cover the following categories:
Our eValuation report features 17 pages of key data and insights related to your latest Truelytics eValuation. The report is broken up into 4 main sections. These include:

A Snapshot allows firm to "take a picture" of the specifics of their Annual Report at any point. This allows a Firm User to compare key performance indicators over time, including your Truelytics Scores, Grades, Firm Value, and Potential Upside. You will also be provided with a detailed report that includes all your inputs and report outputs so you can take a look back and see how your firm has evolved.


